From essential to beautiful — transforming SCCM data
There’s no denying that SCCM is an essential repository. It contains all sorts of useful data, but getting to the information is complex; results are scattered across consoles, reports, queries, status messages, alerts and logs. This SCCM data transformation playbook assesses the best reporting options for your SCCM needs and helps you make intuitive reports and easy-to-process visuals using the data contained in System Center.
Overview
1. Assessing your tactics: how do you currently use SCCM?
SCCM contains loads of essential data on inventory, compliance, site and client status, OS deployment and endpoint protection. But do you regularly use it natively to run reports on your devices, applications and software? You’ve probably found plenty of reports available, but most have limited usability and scope.
The first half of this playbook assesses your current tactics for Configuration Manager; your data usage, monitoring and visualisation. The second half guides you towards a better SCCM strategy and helps you make your play for more effective, intuitive reports, including streamlined patching compliance and OS deployment reporting.
1.1 Tackling 30 years of SCCM legacy development
With almost 30 years of development behind SCCM, there’s complexity and history to battle with.
There are around 500 SCCM reports out of the box. They’re broken down into 58 categories and groups, all accessed using the SCCM console.
Example list of ‘out of the box’ reports:
SCCM has a monitoring node, which holds the ‘reporting’ container. This is where your standard reports can be found, one by one.
But what if you had one intuitive dashboard with quick access to all your high-level SCCM stats, with all the drilldown data you could ever need? Your System Centre reporting would be transformed.
2. Keeping score: reporting in SCCM Current Branch
SCCM is an essential but unwieldy place to find information on your machines. Accessing and manipulating the data held in SCCM generally falls in three locations:
- Reports — these are almost exclusively text-only.
- Console objects — these help create custom queries against the entire SCCM database; the Resource Explorer or deployment monitoring nodes, for example.
- Verbose text logs and status messages — used mostly for troubleshooting.
These out-the-box reports and use-cases are available in SCCM. Are you using them already?
They say seeing is believing. Are you ready to transform your own SCCM data into something beautiful and totally intuitive? It’s free, too.
Sign up to get a Callisto trial2.1 Hardware and software inventory
- You can interrogate hardware and software data in the reporting container of SCCM.
- Your results can be filtered by a chosen collection of computers.
- This data can be exported to CSV, PDF or your chosen output.
Results: The data is presented in a text-based format. The hardware reports provide a click through to view additional data on disk, memory, processors, etc.
- The Software Inventory reporting container holds reports to list the applications installed on groups of devices with click through for information on individual machines.
- You have to provide a few parameters to view the reports, so you need to know information about the software publisher, which collection you want to filter against, or the software versions, for example.
Results: Very basic, readily available.
Assessment: Inventory data is currently spread between various interfaces in SCCM. To get good results from the native tools you need to know your way around SCCM and you need a fair amount of information about what you’re looking for. If these results were instantly pulled into a dashboard tool, you’d have a one-glance view of your hardware and software inventory.
To find out how Callisto can transform your inventory reporting, take a look at section 3:
standard scenarios made beautiful.2.2 Application deployment
Within SCCM you can create, simulate and monitor the deployment of an application to a device.
- Reporting on application deployment is possible within SCCM by accessing Software Distribution – Application Monitoring but the process is complex.
- The report calls for a number of detailed inputs to run.
Example of SCCM ready made chart:
Results: Once the reports are generated, some results show embedded charts and clickable content, but they lack depth.
Assessment: Application deployment reporting is complex within SCCM and calls for loads of upfront information. The results aren’t bad, but they lack a bit of depth and know-how. With a portal that collates and displays all your application deployment data, you’d have a far quicker, more user friendly way of assessing your app deployments.
To find out how Callisto can enhance basic reporting features in SCCM, take a look at section 3:
standard scenarios made beautiful.2.3 Software update health and compliance
The update compliance of your devices is an area of SCCM that your non-technical audiences will be interested in, so it’s worth having an easy-to-access report on software update health.
- It’s possible to check software update health by using the reporting container within SCCM, but the native reports are numerous and clunky.
- Go to: Monitoring – Reports – Software Updates – Compliance – Compliance 9 – Overall health and compliance and input your Software Update Group, Limiting Collection and date range for the information you need.
Results: You can output visual charts from your software updates reporting in SCCM, but you can’t drill through for more information, or take any action.
Assessment: Only a few parameters are needed to generate these results, but the drill-through data is unintuitive and data tables offer no interactivity. This view can’t tell you the individual machine state and the views that can are difficult to interpret. If you had a dashboard portal, this data could be filtered, searched and displayed — and then actioned — however you want.
To find out how Callisto can overhaul your software update health and compliance reporting, take a look at section 4:
enhancing patching compliance.2.4 Application and software metering
Software metering allows for inventory software usage. It allows you to see how many copies of an application has been deployed to computers and among these you can see how many actually use the application.
- Information on metered software programs is a basic capability in the monitoring node in SCCM.
- Users can run a number of reports, like ‘total usage for all metered software programs’, for example.
- Select a single month and a year to report on to display the relevant data.
Results: Once you drill deeper into the results, the data isn’t clickable. Results are there, but they are basic.
Assessment: There are plenty of reports easily available on app and software metering within SCCM, but the results are limited. The in-built reporting displays the data, but the information is text only. Your results could be transformed with interactive visuals and drilldown data if you were using a dashboard to run these reports.
To find out how Callisto can transform your application and software metering, take a look at section 3:
Identifying an advantage: standard scenarios made beautiful.So, the data SCCM hosts is well-suited to dashboard and chart representation, generally speaking.
The examples we’ve mentioned are just the tip of the iceberg; there are close to 500 reports included with SCCM that you can run. There are, however, some obvious gaps in common requirements. Of the 500 out of the box reports, only five of them have any chart features.
3. Identifying an advantage: standard scenarios made beautiful
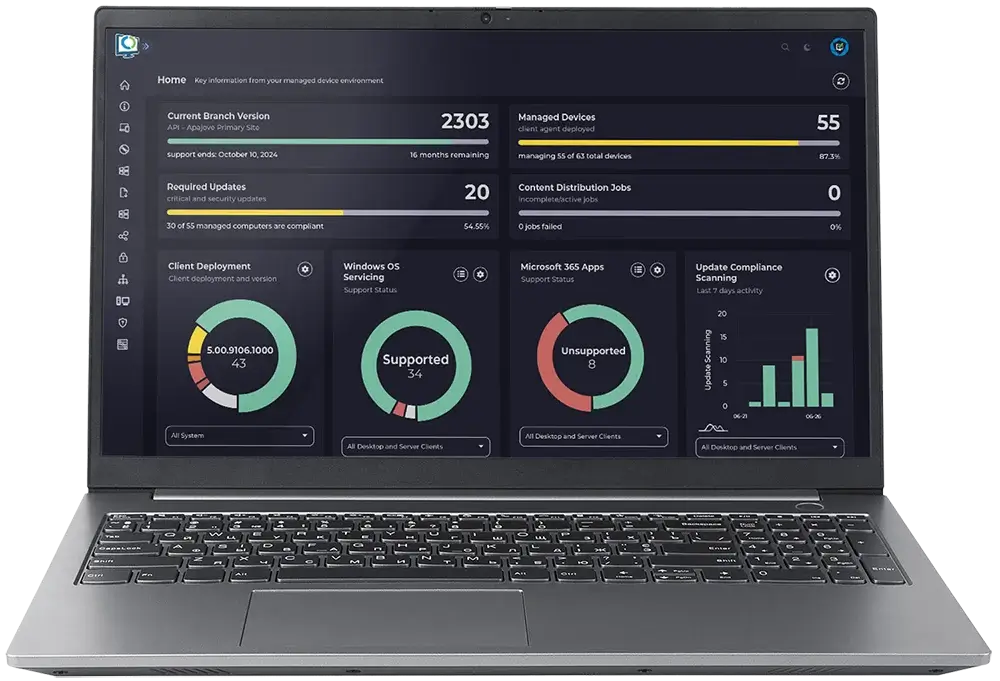
So, we now know that SCCM’s native reports deliver some basic insight. But getting the exact results you need — and giving access to non-technical users — is very difficult. By using an interactive portal like Callisto, you can easily view and act on your SCCM data in seconds.
In the second half of this playbook we will look at some ways to unearth the basic data contained within SCCM and turn it into crystal clear, responsive insights. If you’re interested in running more complex scenarios, read patch compliance or OS deployment.
Is today the day you make SCCM more accessible and actionable for your business? You’re just one click away.
Get started with Callisto for free3.1 Hardware and software inventory
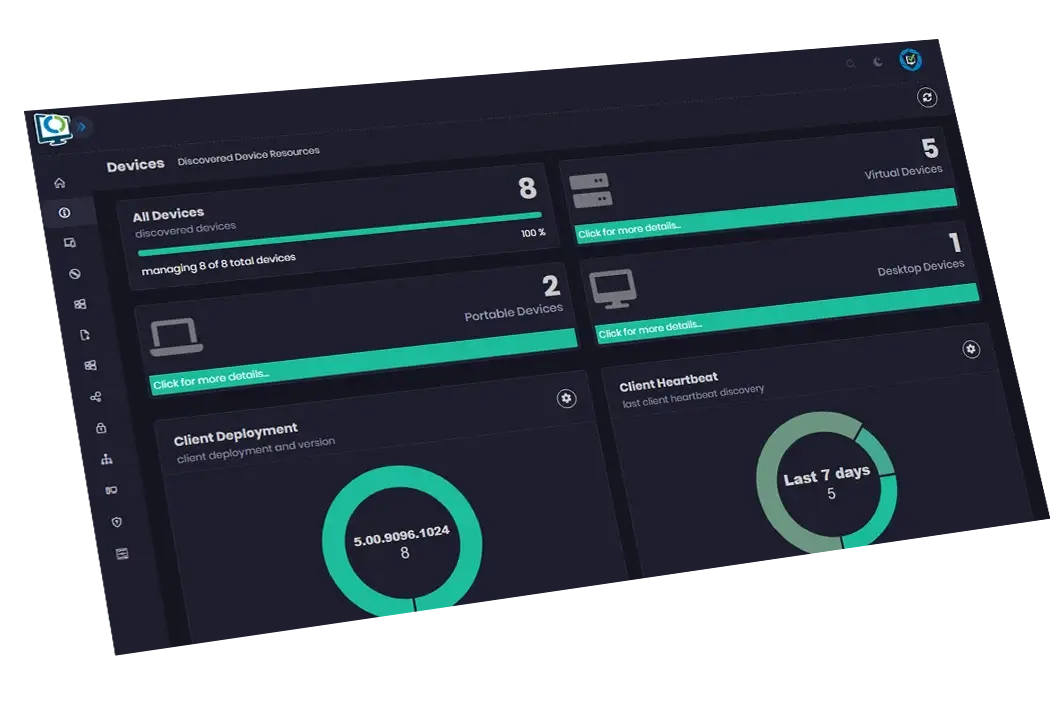
We have assessed the basic, text-based inventory reporting in SCCM in section 2. Callisto, on the other hand, is a far quicker, friendlier and more intuitive interface. The information is gathered in a single location rather than spread all over the SCCM console.
- To interrogate software using Callisto, use the Software Client Inventory page.
- The same filtering can be applied as with SCCM’s native reports, but results are lightning fast.
- To make analysis more straightforward, multiple versions of products are collated into a single dataset.
Results: Immediate and easy to access. By clicking through on the results you get a list of all versions, even if there are multiple versions installed.
Assessment: Instead of having to pull data from across various SCCM interfaces, inventory information with Callisto can be glanced at in a single location. Drilling down further to any individual machine shows the device modal software tab.
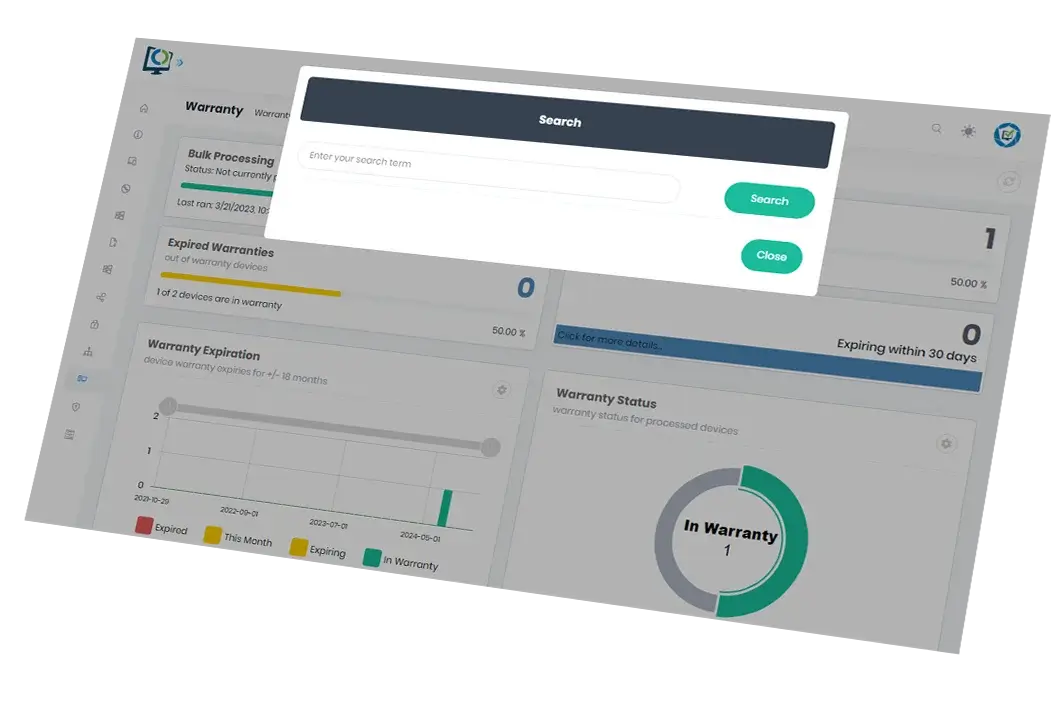
TIP: Unlike SCCM’s native reporting capabilities, Callisto makes it simple to identify devices with insufficient RAM, low disk capacity, devices by vendor, and so on. SCCM contains this data, but the results are complex to unearth. Callisto also provides integration with warranty services to bring warranty information into the SCCM environment.
To see what Callisto can do for your own inventory reporting processes, contact us for a 30 minute demo.
Contact us3.2 Application and software metering
Any IT department wants to make sure that the software it’s managing is delivering value for the business. SCCM’s software metering should make it easy to track where software is unused so that licenses can be reclaimed and redeployed, but as we saw — the functionality is lacking.
- With Callisto, you can instantly see where software is unused so that licenses can be reclaimed and redeployed.
- Rather than the text-based report results held within SCCM, Callisto brings this information to life in seconds.
- Results are displayed for the last three months, by default. And up to 12 month’s data is available at a click.
Results: Interactive, highly visual. Colour-coding makes it easy to understand and take action.
Assessment: Running reports on software metering in Callisto provides instant understanding of where licenses can be redeployed. Clicking through to a specific application in the Callisto portal displays the relevant data, overcoming a common frustration within SCCM, natively.
Keen to see the hidden beauty and functionality of your SCCM software and application data through Callisto for yourself?
Start your free trial4. Making a new play: enhancing patching compliance
Government institutions, healthcare services and financial companies tend to have the most stringent regulatory compliance requirements, but most organisations must comply with governmental regulations, service level agreements and industry association mandates. So, compliance and patching can become complex for IT departments. A number of technical hoops need to be jumped through for a company to confirm they are “compliant.”
From a technical perspective, there are many moving parts. The infrastructure must be functioning to sync correctly with Microsoft. Your clients need to access the latest scan package, perform a scan and submit their results. From there, patch content must be approved, downloaded and staged on the distribution servers. You need to locate the content, evaluate which updates to install, prompt a restart if necessary and adhere to maintenance windows, user schedules, and more.
To make your life easier, you need a quick overview of compliance status, and to see where action is needed. It’s certainly possible to report on software update compliance with SCCM, but it’s time consuming and complex.
- The Overall Compliance report lets you select an update group and collection.
- From here, it’s possible to drill through to find out which updates are missing.
Results: Limited. Drill through functionality is missing so it’s hard to understand the deployment or Software Update Group (SUG) membership of these updates.
Assessment: Yes, it’s possible to report on patching and compliance within SCCM. System Centre shows which updates are required, but there’s no link between these results and the original selection criteria. The process is clunky, and incredibly time consuming, and has room for error.
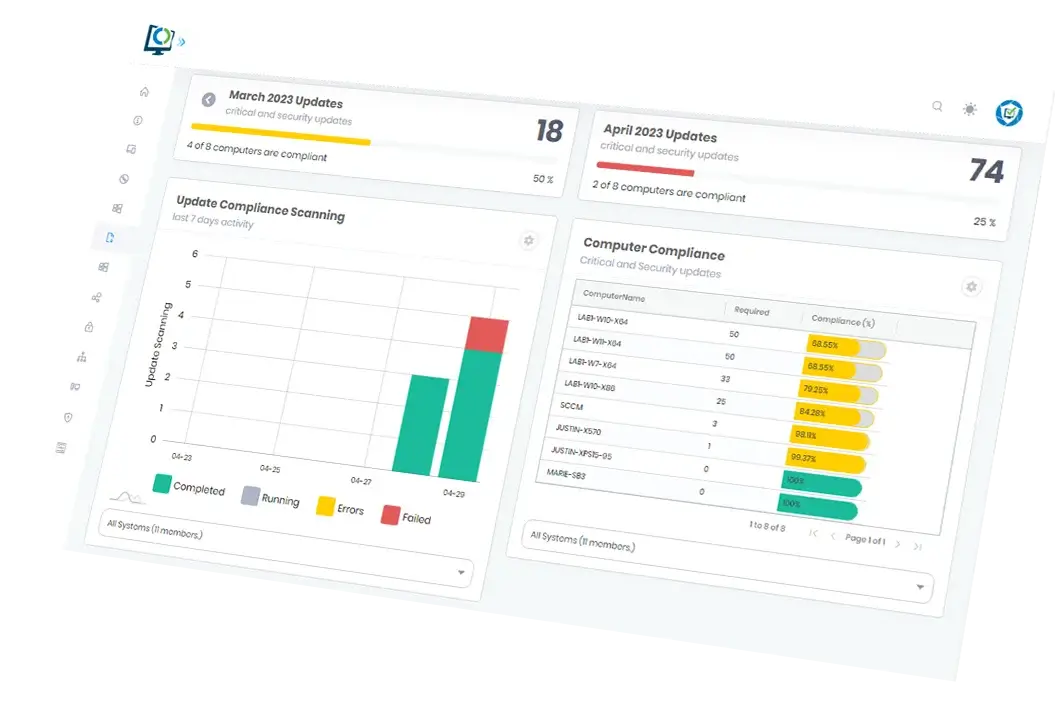
For easier-to-run, accurate high-level and granular data on your patching compliance, Callisto is a far better option.
Get in touch to arrange a personalised demo
- The top level dashboard is designed to show you everything you need for a software update overview at a glance
- This data can be filtered, searched and displayed however you want.
- A modal screen displays all the data needed for a specific Software Update Group.
- The Members tab shows all the updates needed in a specific group.
- The deployment tab allows the user to view deployment status for the update group.
TIP: Use Callisto to ensure your compliance statistics are entirely accurate and up-to-date. SCCM doesn’t natively provide the functionality to remove obsolete machines from your compliance reports, unlike Callisto. So this is the peace-of-mind you need while patching.
5. Setting a new strategy: streamlining OS deployment
SCCM can be a great OS deployment tool. From the most basic to the highly-complex deployment scenarios, an SCCM Task Sequence can do it all.
Monitoring and reporting on this area of SCCM can be a real challenge, however, with little data available and accessible in the console.
- Within the task sequences node in SCCM, users can select their chosen production operating system’s task sequence.
- The ‘deployments’ option in the bottom right allows users to drill through to understand the related deployments to their selection.
- Basic data is presented in a limited-visual format.
- By viewing the status, the monitoring node is opened automatically, showing production status.
- A list of successful machines is then displayed, and information on when they were deployed.
At this point, the results become problematic. The overall status of the tasks is still available, but results may be displayed as multiple entries from running the task sequence multiple times.
Results: It’s possible to drill down to a summary view and status view which shows in-depth information on individual task status on the device, but results may be displayed more than once, which is confusing. The overall status of the tasks is still available but charts aren’t clickable or interactive in any way.
Assessment: The Reporting node holds plenty of task sequence containers. The deployment status container, for example, contains 11 potentially useful reports. The full text output is available to be interrogated for troubleshooting specific machines. Data can be drilled down further, but the results aren’t interactive or intuitive. Ideally, you want faster, more actionable reports on your OS deployment status.
Stop scrolling and start experiencing. Run your own SCCM reports through our lightning fast portal for free.
Start your free, no-obligation Callisto trial5.1 More intuitive OS deployment
Callisto offers a far more visually appealing and intuitive way of displaying your OS deployment information. There’s a dashboard and drilled down format, whichever you prefer.
- The top level dashboard animates all vital summary information.
- The OS deployment chart shows the last 10 days of deployment activities.
- It shows all task sequences by default, but these can be filtered and changed according to the information required.
If you need more information than the summary dashboard provides, you can drill down even further on the OS deployment page.
This drill down page can tell you:
- More information from specific date ranges.
- Number of machines built.
- Minimum average and maximum runtime statistics.
- Average build times.
- How to filter by collection.
5.2 Identify errors. Take action
Perhaps most importantly, when it comes to OS deployment, IT teams need to know which activities haven’t been completed successfully on which devices, and take action.
- To find deployment errors in the task sequence, Callisto has a quick, friendly view to identify which devices show a failed status.
- Drilling down to task level shows verbose output for any action.
- The build history of the device is always available from the moment the task sequence begins execution, to long after the build completes.
Results: Extensive but highly intuitive. You can choose between dashboard stats or granular data, whichever suits your scenario best. With visually beautiful results and endless interactivity, you’ve always got the information you need at your fingertips.
Assessment: Callisto transforms your OS deployment reporting. It provides a highly-visual guide to your OS deployment task sequences and required actions. You can quickly and easily identify where activities have failed, and see where follow up action is required. All in one central location.
6. What’s our conclusion?
So, we’ve assessed SCCM and we know the information is absolutely essential to your business. It holds countless valuable data points and plenty of reporting capabilities, but the processes are slow, complex and results are limited. To get more from the valuable data in SCCM, you need a dashboard portal like Callisto to easily access, visualise and take action.
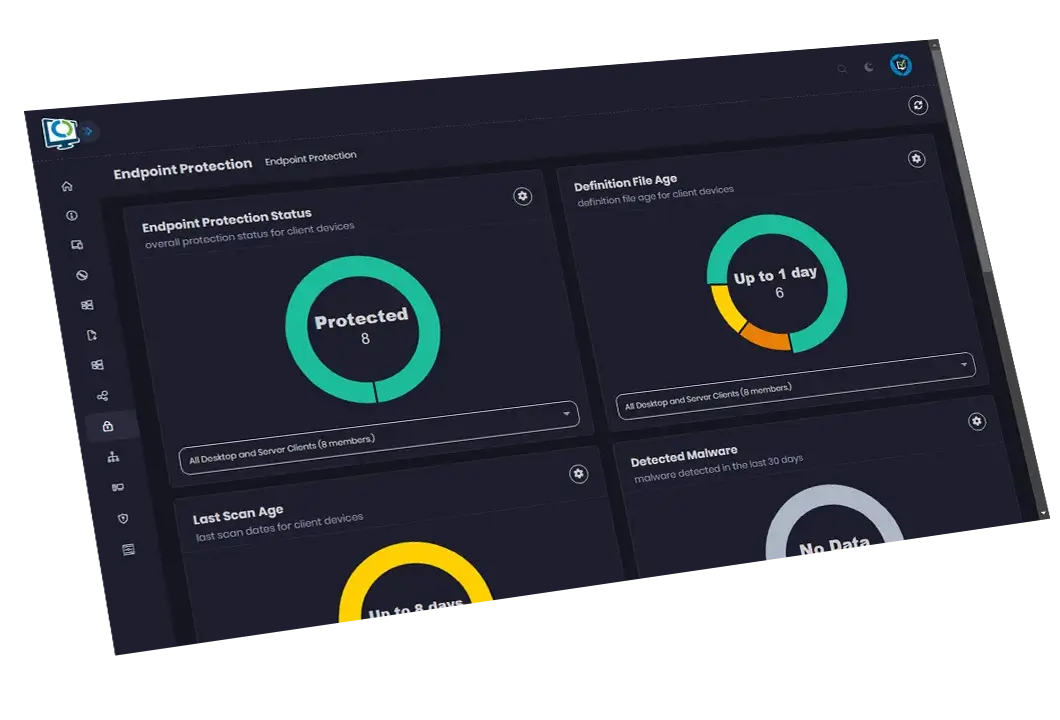
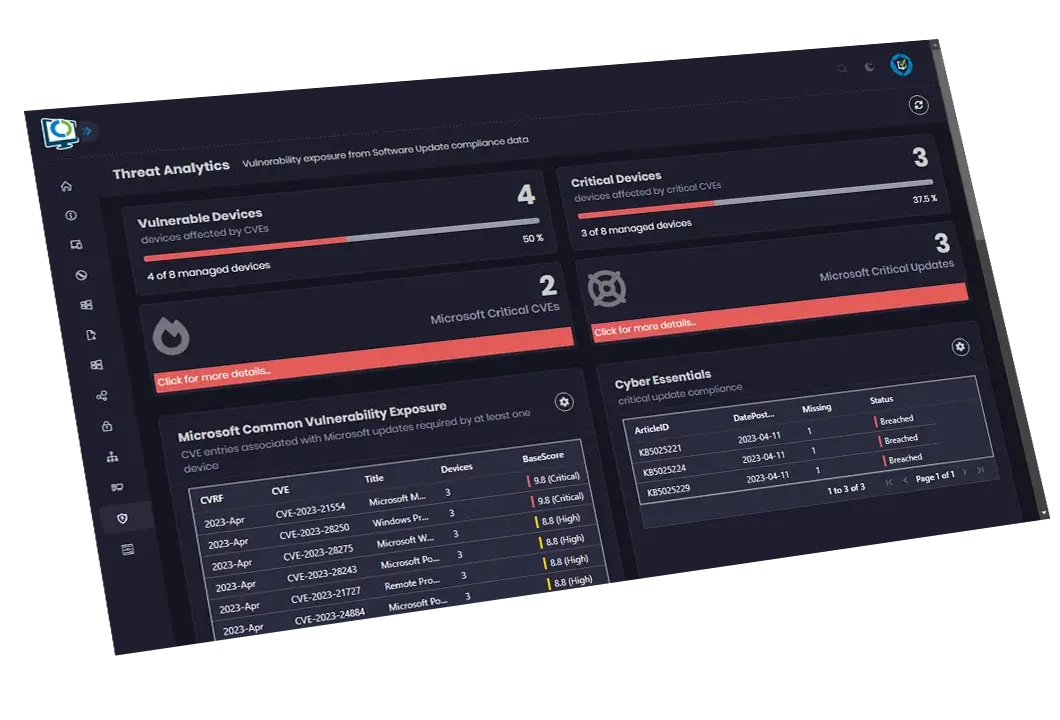
Callisto converts your complex datasets from System Center Configuration Manager into crystal clear, responsive visuals. So intuitive, your non-technical users can easily interrogate it and take action. Through one interactive portal, Callisto is a single window into your entire Microsoft SCCM environment.